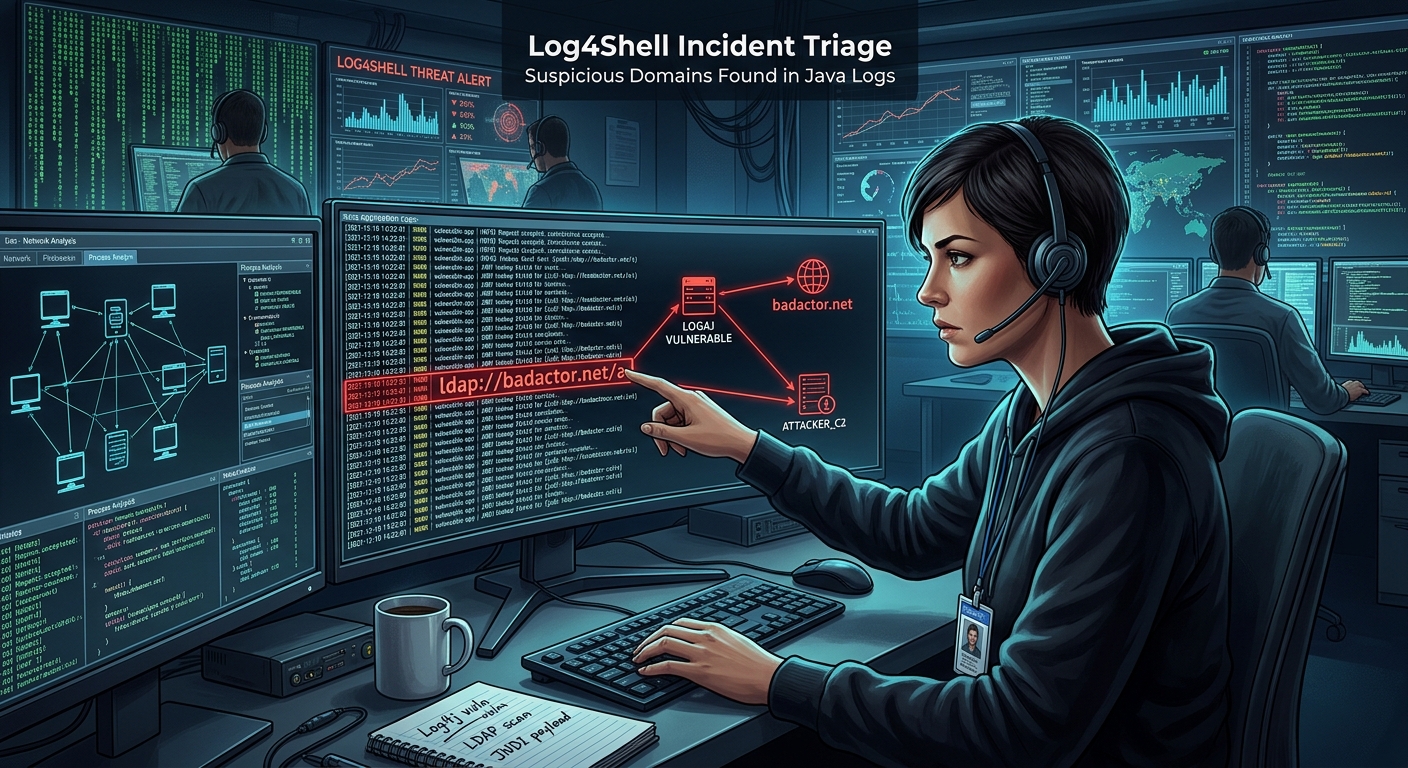
A strange domain appears in a Java application log. Minutes later, someone finds a DNS query for the same name. That deserves attention, but it does not yet tell you whether an attacker executed code. Your job is to connect the request, the application, and the network activity without letting one alarming string become the whole incident story.
This walkthrough follows that evidence chain. Start with the original log entry, establish which workload handled it, and check what happened next. Keep separate findings for attempted exploitation, a triggered lookup, and confirmed execution. Those distinctions help your team contain the right systems and explain its decisions clearly.
Your Triage Priorities
- Preserve the original request and its application context.
- Correlate DNS and outbound traffic with the affected workload.
- Treat registration metadata as supporting context.
- Separate lookup activity from evidence of code execution.
- Contain exposure, preserve evidence, and replace vulnerable dependencies.
Start With the Request That Carried the Domain
Open the raw event before relying on an alert summary. Security tools may shorten long fields, decode characters, or extract a hostname without preserving its surrounding text. You need to know where the suspicious value appeared and which component recorded it.
Check request headers, URL paths, query parameters, submitted form fields, and error messages. Also inspect application-specific values that get logged during authentication or validation. A domain inside a user-agent field has a different context from a domain in a configured integration endpoint.
Look for JNDI-related syntax, lookup expressions, and references to LDAP or RMI. Obfuscated attempts can split meaningful strings across several expressions or use encoded characters. A search for one literal payload pattern will miss some attempts. Use detection logic that recognizes related structures while retaining the original bytes for review.
Do any decoding in an isolated analysis workflow. Treat suspicious expressions as inert text. Do not paste them into an application, logging console, or test endpoint that might interpret them. Avoid opening the domain in a browser. An analyst-generated request can confuse the timeline and contact infrastructure outside your control.
Capture Enough Context to Reconstruct the Event
- Original timestamp, timezone, ingestion time, and known clock offset.
- Request identifier, route, response status, and relevant input fields.
- Application instance, host, process identifier, container, or pod identity.
- Suspicious hostname, surrounding expression, and original encoding.
- Source address and trusted proxy records needed to trace the request.
Preserve the source event separately from your working notes. If your log platform truncates large fields, check the original application or ingress records. Record missing data explicitly. A blank field and a field that was never collected are different investigative limits.
Check Whether the Java Workload Was Exposed
A malicious-looking request can reach an application that cannot process the attempted lookup. Establish what ran at the time of the event, rather than assuming the current deployment represents the earlier system.
Inspect deployed artifacts, dependency inventories, image digests, and release records. Identify whether the application included an affected log4j-core dependency. The presence of log4j-api alone does not establish exposure to CVE-2021-44228. Check packaged dependencies inside application archives and bundled vendor components too.
Record the Java runtime, logging configuration, and relevant startup settings. Confirm whether the suspicious input could reach the logging path. An ingress access log may record an attack string even when the application rejected the request before processing it.
If the workload has already been replaced, use the historical image digest and deployment manifest to reconstruct its dependency state. For commercial software, compare the installed build with the vendor's advisory and fixed release information. Filenames alone are weak evidence of the code actually loaded.
Connect the Log Entry to DNS Activity
Search DNS telemetry around the event time. Begin with a modest window, then widen it to account for clock differences, asynchronous processing, and collection delays. Normalize timestamps to UTC while preserving the source timezone.
Search the exact hostname and inspect related query names. A request may contain a unique label that makes correlation stronger than a match on the parent domain alone. Capture query type, response code, returned addresses, resolver identity, and the originating client when available.
A DNS lookup proves that a name-resolution attempt occurred somewhere along the observed path. It does not prove that a remote class loaded or that code executed. Security scanners, inspection systems, and analyst tools can also resolve suspicious names. Attribute the query before attaching it to the Java process.
Shared resolvers make this harder. A query leaving a central resolver may represent many internal clients. Check resolver client logs, endpoint telemetry, or container network records to narrow the source. In Kubernetes, retain historical pod-to-node mappings because a current pod address may belong to a different workload.
An absent query is also limited evidence. Cached answers, incomplete retention, direct IP connections, or an unobserved resolver can leave gaps. Phrase the result as “no matching DNS event in the available records” when that is all the evidence supports.
Add Domain Registration Context Without Overweighting It
Once you have the suspicious hostname and its event timeline, use an RDAP lookup to check available registration dates, registrar details, and abuse contacts for the registered domain. Save the response and lookup time with your case notes. Registration records may change after the incident.
A domain registered shortly before the request can strengthen concern when other evidence already points toward abuse. An older registration does not establish safety. Attackers can compromise established domains, use delegated subdomains, or operate through hosting platforms whose registration history says little about the individual tenant.
Read the fields carefully. A record update date is not necessarily the creation date. Privacy services and redacted registrant fields are common and do not establish malicious ownership. An abuse contact gives you a reporting route, not an identity for the person who sent the request.
Registration metadata provides context rather than proof of malicious activity. Record it alongside the request, DNS, and network findings. Keep it from outweighing stronger evidence about what your own workload actually did.
Follow Outbound Connections Beyond Name Resolution
Next, inspect firewall events, flow logs, proxy records, and endpoint network telemetry. Search the addresses returned by DNS during the incident window. Present-day resolution can point somewhere else, especially after infrastructure changes or takedowns.
Match connections to the affected host or workload. Capture destination address, port, protocol, connection result, timing, and transferred bytes where available. LDAP and RMI traffic can be relevant, but restricting the search to their conventional ports creates blind spots. Check other unusual outbound destinations and subsequent HTTP or HTTPS requests.
Distinguish an attempted connection from an established session. A firewall block supports a different finding from a completed exchange. Even an established connection does not, by itself, prove successful exploitation. You still need application or endpoint evidence to understand what followed.
Account for address translation. A public egress address may represent an entire cluster. Correlate firewall session records with internal addresses, node records, and process telemetry. When attribution remains uncertain, preserve that uncertainty in the incident assessment.
Build a Timeline That Tests the Exploitation Hypothesis
Bring the evidence into a single timeline. A useful sequence might show an inbound request, an application log entry, a matching DNS query, an outbound connection, and later process or filesystem activity. Each additional link should have an identifiable source.
Check application traces and background jobs as well as host events. The request might have entered a queue before a worker logged its contents. A delayed lookup could therefore belong to another process on another machine. Follow the data through the application rather than forcing every event into the initial web server.
Look for unexpected child processes of Java, unfamiliar executable files, changed startup entries, unusual scheduled tasks, or unexplained credential access. Also inspect unexpected class-loading activity when your telemetry supports it. Successful execution does not always create a child process.
Compare activity with deployment and maintenance records. A legitimate release can explain a process restart or new file. It cannot automatically explain an unrelated outbound connection. Evaluate each event against its operational context.
Separate Findings by What the Evidence Supports
- Attempt observed: Suspicious input reached a recorded application or ingress path.
- Lookup observed: Correlated evidence connects name resolution or a lookup attempt to the workload.
- Outbound exchange observed: Network records show communication with the destination.
- Execution supported: Endpoint or application evidence demonstrates unauthorized execution.
- Visibility limited: Missing records prevent a stronger assessment.
These findings can coexist. A case may contain a confirmed outbound exchange and limited visibility into execution. Avoid forcing an uncertain incident into a reassuring category just because a required sensor was absent.
Tune Detection Around Correlated Behavior
Use domain matches as one detection input. Combine them with suspicious expression structures, workload identity, DNS activity, and outbound traffic. Correlation helps prioritize alerts that deserve immediate investigation.
Retain both raw and normalized fields in your log pipeline. Decode only through bounded, documented transformations. Test detection changes against representative historical events, including encoded inputs, truncated records, and legitimate application traffic.
Distinguish approved scanner activity through documented source ranges, test windows, and identifiers. Keep those events searchable. A scanner match can explain a request, but an unexpected callback from a workload still deserves review.
Contain the Workload and Preserve the Evidence Trail
If you find unauthorized execution or strong evidence of an active compromise, isolate the affected workload through your incident response process. Restrict unnecessary outbound access and block confirmed malicious destinations where appropriate. Consider whether affected service credentials could permit access to other systems.
Preserve volatile evidence when feasible without allowing harmful activity to continue. Container replacement, restarts, and scaling events can destroy process state and temporary files. Capture relevant process and network state, deployment metadata, logs, and storage snapshots with approved tools.
Store evidence in access-controlled locations. Record collection times, collectors, source systems, and integrity hashes for exported files. Preserve original artifacts and analyze copies. Document every containment action because those actions change the timeline too.
If compromise exposed credentials, revoke or rotate them after controlling the affected execution environment. Rebuild compromised workloads from trusted artifacts. Removing one suspicious file does not establish that an attacker has lost access.
Close the Lookup Path and Verify the Repair
Remediation must cover the deployed application, its bundled libraries, and the images used to recreate it. Upgrade to a currently supported Log4j release appropriate for the runtime, or install the vendor's corrected product build. Check applicable security advisories before selecting the target.
The December 2021 patch sequence matters. Apache's security advisory describes the initial CVE-2021-44228 fix as incomplete under certain configurations, tracked through CVE-2021-45046. CVE-2021-45105 addressed a separate denial-of-service issue involving recursive lookup evaluation. Those distinct issues are a reason to assess the full advisory history rather than treating the earliest emergency update as a permanent stopping point.
Rebuild and redeploy affected artifacts, then verify the dependency loaded by the running application. Update dependency locks, image inventories, and CI checks so an older bundled copy cannot quietly return. Temporary WAF rules and egress restrictions can reduce exposure while repairs proceed, but dependency remediation remains necessary.
Close the case with an evidence-based statement: what reached the application, what the workload contacted, what execution evidence exists, and which gaps remain. Assign owners to any remaining repairs. A suspicious domain becomes useful incident evidence when you can explain its place in that chain and show that the vulnerable path has been removed.